


Where to Look for Happiness (and How Twitter Data Can Help!)
HAIFA, ISRAEL and NEW YORK (May 10, 2018) – What is the connection between a geographic location and the emotions it elicits? Which places tend to make people happy and which cause them pain or sorrow? A joint research team from the Technion-Israel Institute of Technology Faculty of Civil and Environmental Engineering and AT&T Research Laboratories has discovered that there is a correlation between location and emotional state.

Prof. Yerach Doytsher, of the Technion Faculty of Civil and Environmental Engineering
The research was performed as part of the doctoral work of Ben Galon, under the supervision of Dr. Yaron Kanza, of AT&T Research Laboratories, and Yerach Doytsher, of the Technion Faculty of Civil an Environmental Engineering. The three developed a method which analyses social media posts, such as Twitter tweets, to map emotions in an urban space.
The emotions map generated with this technology presents the prevailing emotions expressed in various locations. Such maps have a variety of possible applications, including assisting tourists choose spots that are expected to elicit happiness or romantic emotions, and to avoid places that stir up emotions like anger and hatred. Using the maps would enable urban planners to identify areas that elicit negative emotions and to tailor them to generate other emotions. And social scientists could learn about the correlation between community behavior and the environment, and use that information to identify areas that enhance artistic emotions or that arouse anger that can lead to political activism.
To date, emotion maps have been based on monitoring human volunteers equipped with a sensor that registers numbers like pulse and blood pressure. This approach highly limits the quantity of data that can be collected. With the research team’s new approach, however, maps can be generated from an enormous volume of data.
In the framework of this research, the researchers correlated emotion to a location by analysing geotagged posts. The algorithm they developed enabled them to identify significant correlations between emotion and a location, while filtering out random correlations.
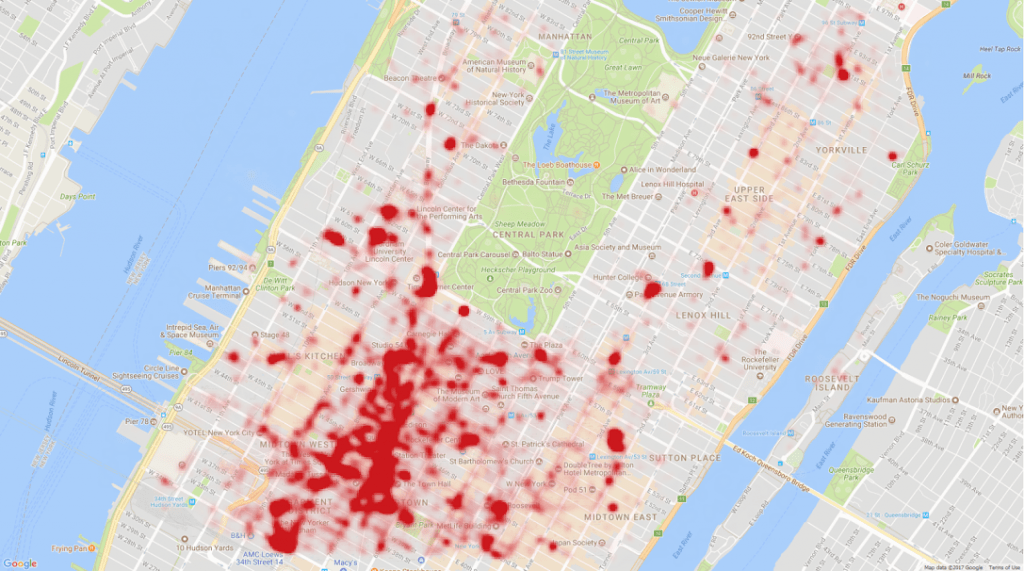
Illustration 1. Clusters of posts expressing happiness near Washington Square
The researchers had to overcome three key challenges. First, the social media posts were typically short, sloppily written and contained expressions, abbreviations and slang that challenged accurate emotion characterization. Second, a broad spectrum of emotions was expressed in each place and therefore, it was important to filter out the weak and random correlations so that only the significant correlations were maintained. Finally, to obtain significant results within a short time, a fast algorithm, capable of querying an immense volume of data, was necessary.
The proposed approach was assessed on a pool of tens of millions of posts generated in New York City. High levels of anger, for example, were identified in public transportation stations; sadness and anger were prevalent in high schools; and anxiety could often be found on university campuses as well as in Madame Tussauds Wax Museum. Happiness was detected in restaurants and parks, at times accompanied by surprise. All the assessed emotions were prevalent in theatre and cinema areas.
There were some surprises, said the researchers, including the high expression of sorrow around the Apple flagship store in Manhattan, and a high frequency of expression of rejection and disgust in a high school specializing in design.
According to Galon, “further research will focus on in-depth analysis of the results, in efforts to understand the roots of these emotion-location interrelationship, and on integrating a time parameter to the new emotion maps.”